Gaming influencer marketing ROI is easy to fake and hard to prove. Big reach numbers are cheap to produce. What matters is whether the campaign did the one thing you needed it to do, and whether you agreed on how to count it before anyone went live. This page is how we do that with our partners, with numbers from our own cases.
Pick the goal before the creators
Every campaign we run starts with one main goal. Launch visibility, installs, wishlists, store revenue and retention all need different creators, formats and budgets. A campaign built to do all of them usually does none of them well.
So the brief comes first. If the goal is to be the most watched game on Twitch in launch week, we plan for live streams with high concurrent viewers in a tight window. If it’s installs for a mobile game, we lean on short form video and creators whose viewers are on their phones. If it’s revenue from an established game, we look at creator programs more than campaigns.
Then we agree on the target number and how it’s calculated. That second part is where most arguments about ROI come from later.
The metrics that matter per goal
Launch and awareness: Viewer minutes and CCV
Viewer minutes are average concurrent viewers multiplied by minutes streamed, per stream. They add up cleanly across creators and days, so they’re our main measure of attention on Twitch. For Call of Duty: Black Ops 6, 72 creators across three markets delivered 21.84M total viewer minutes, and the game was the most viewed on Twitch during launch (Black Ops 6 case).
Average CCV (concurrent viewers) tells you how many people were actually watching at once. Peak CCV is the highest moment. Both are useful per creator, and neither should be added across creators or averaged into one campaign figure without saying how.
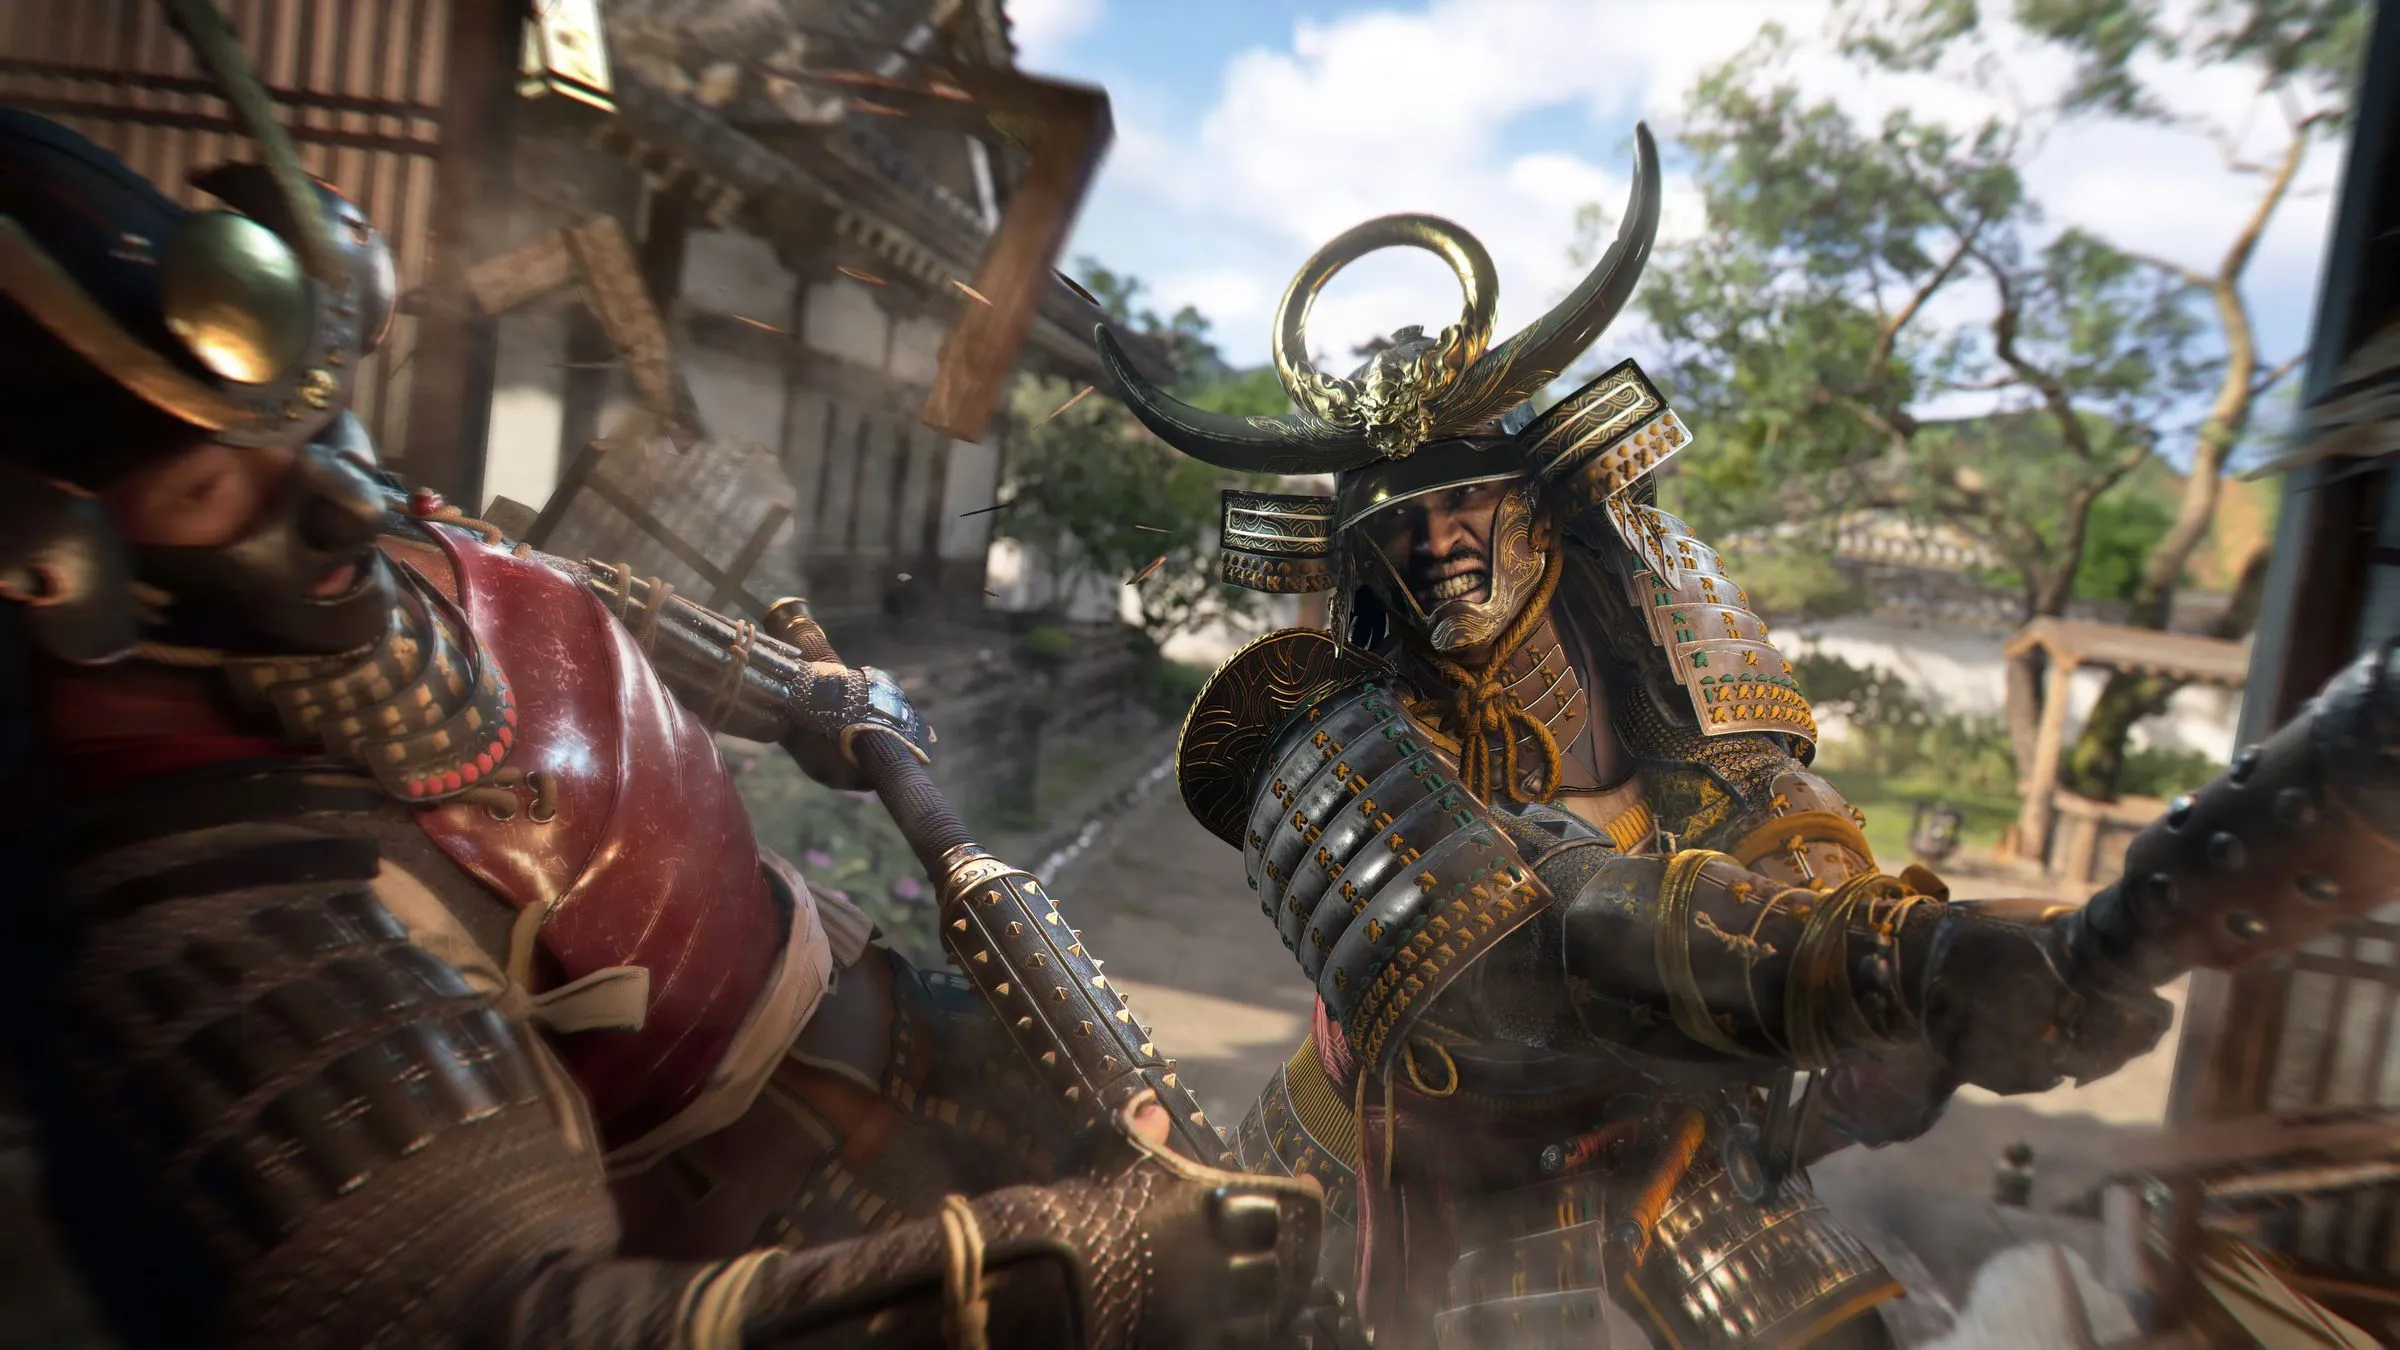
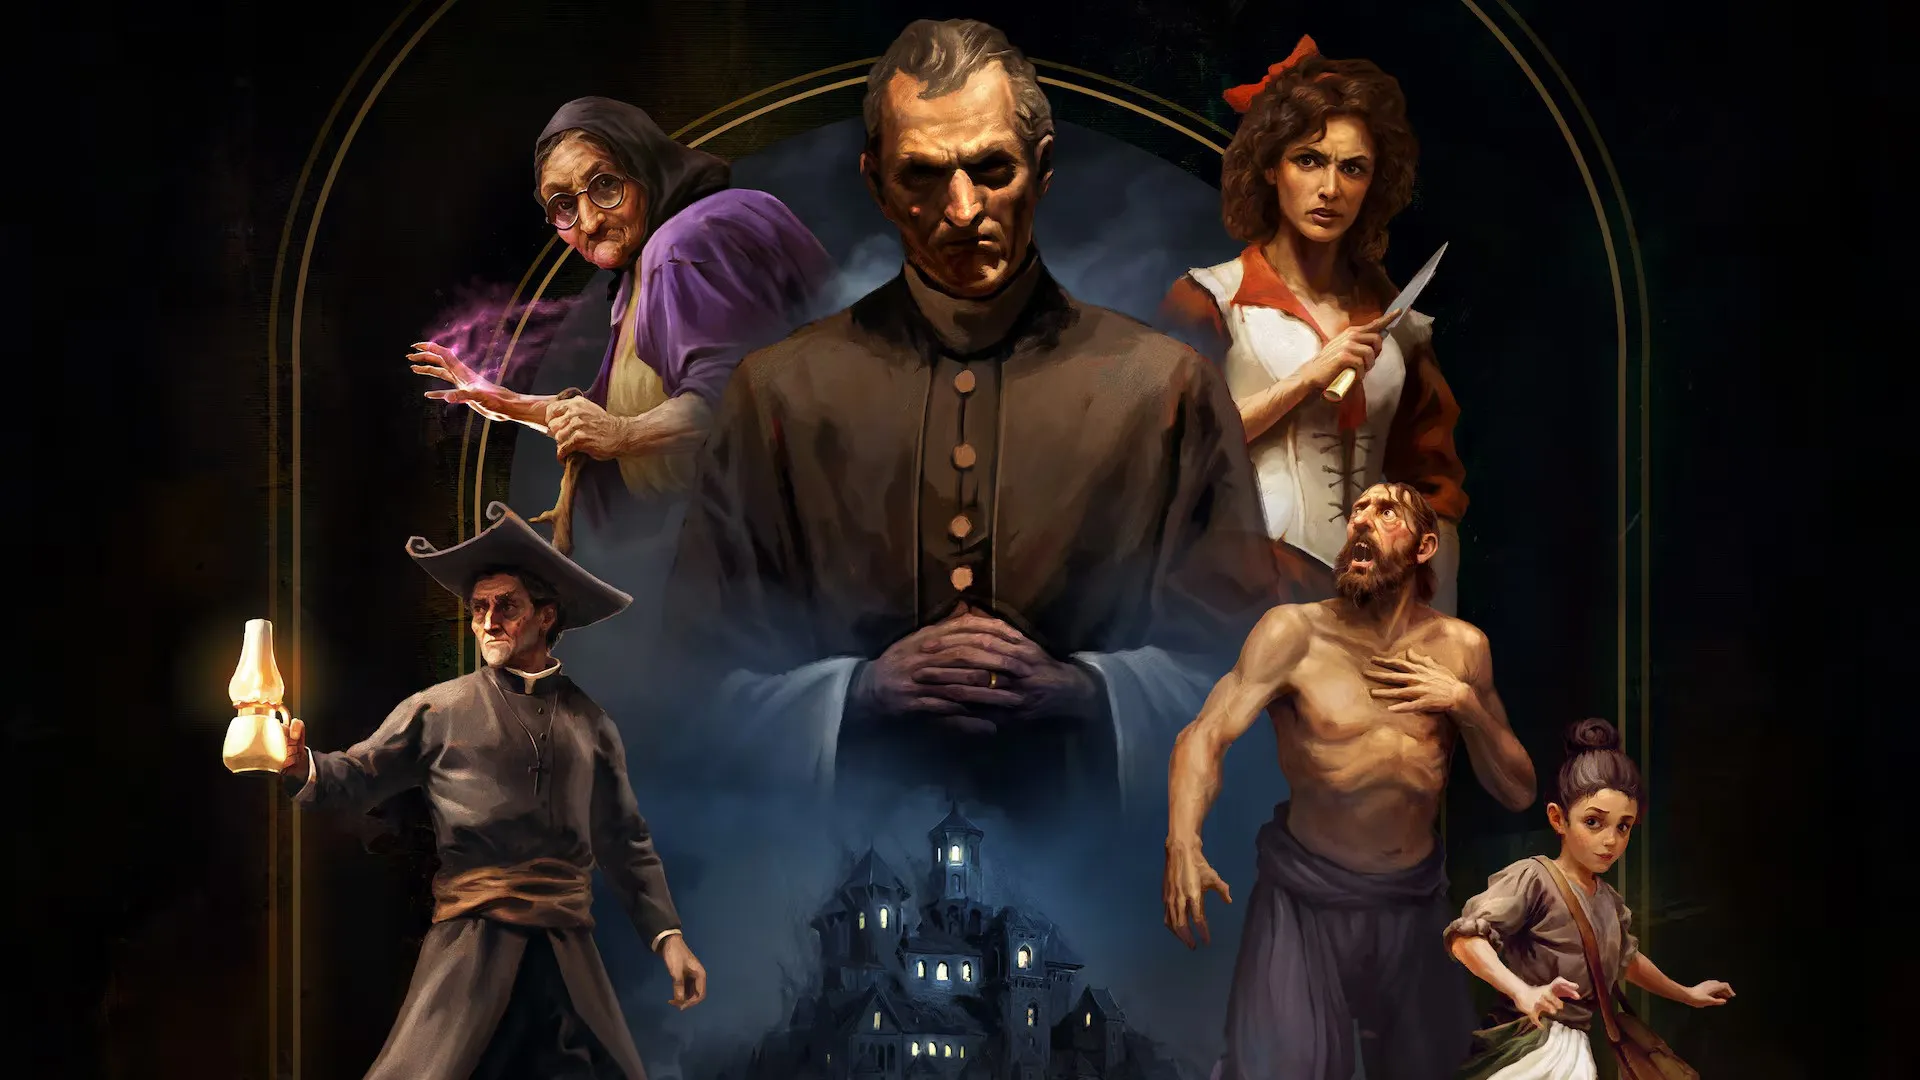
Cost per hour watched turns attention into efficiency. In the Nordics, our Assassin’s Creed Shadows campaign delivered 1.8m viewer minutes against a 1.3m target, an increase of 39%. In the UK, cost per hour came in 46% lower than target. For The Stone of Madness, Twitch delivered viewer minutes 30% above target in the launch phase, with a cost per hour 23% lower than targeted.
Installs and wishlists
For mobile games, installs are the goal, and clicks are the first signal. They’re also the most fragile. For NBA 2K25 MyTEAM Mobile, the top TikTok creators drove 1.6m+ views and 8.3k+ clicks, while on Instagram click through was limited. Same campaign, two very different paths to an install (NBA 2K25 case).
For Steam games, wishlists play the same role. Tracked links show which creators sent traffic to your store page. The wishlist curve around stream dates shows the rest, less precisely.
Store revenue through Creator Codes
Creator Codes, our Support-A-Creator program, give the cleanest revenue line in creator marketing. Each purchase made with a code belongs to one creator. You can see who earns their share and who doesn’t, and adjust tiers from there.
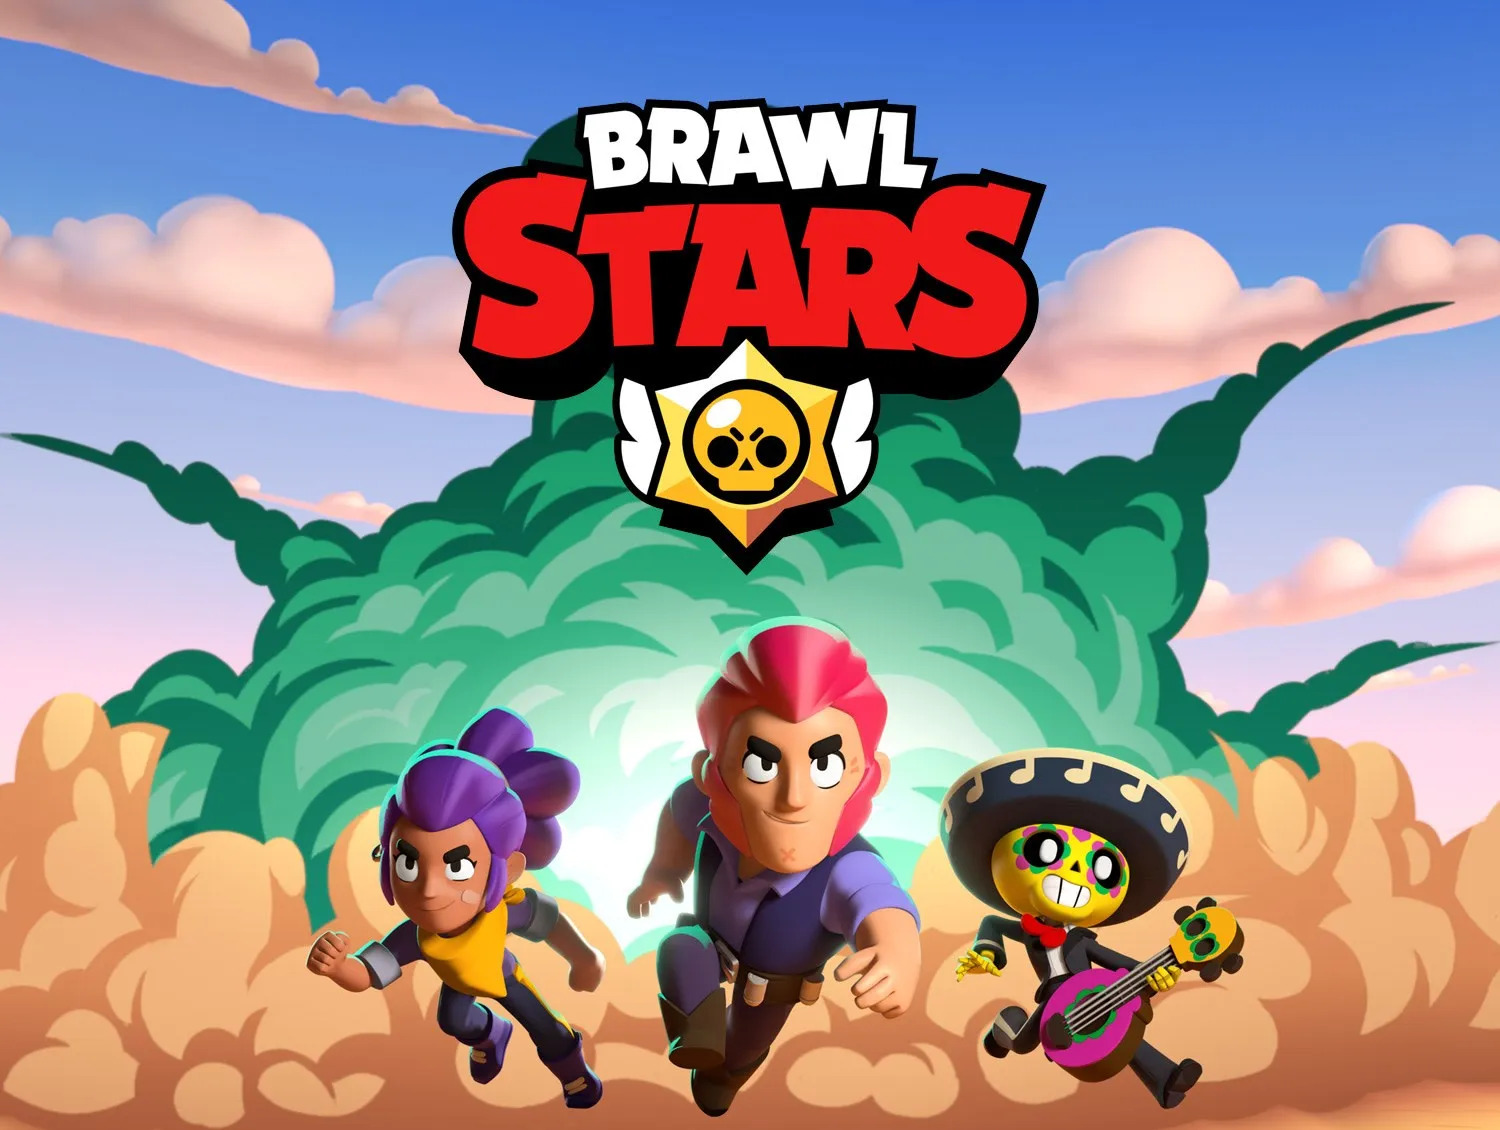
Codes can also measure behavior. For Brawl Stars, we tracked how many players entered each creator’s code and how many of those reached 1,000+ trophies or Gold or Diamond rank, and creator bonuses followed how their communities performed.
Retention: Players and creators who stay
Retention is the slowest number and the most valuable one for live ops. On the creator side, we watch who keeps streaming your game after the paid period ends. After the Dying Light 2 launch, more than 50% of the Twitch creators from our campaign continued playing and streaming the game (Dying Light 2 case). Community Insights tracks that over time, sorting creators into new, active, at risk and churned.
Setting targets you can hold us to
A target only works if both sides calculate it the same way. We write down three things before launch: the metric, the definition and the source. Viewer minutes from our platform and viewer minutes from a third party tool can differ, so we pick one and stick to it.
We also set targets per market and per phase, when a campaign has them. That’s how the Assassin’s Creed Shadows report could say the UK and the Nordics both beat their targets, in different ways. And we report live during the campaign through our platform, so a weak concept gets fixed while there’s still budget left.
Ask any partner how its typical creator does against the estimate it gives you. Here’s ours. On Twitch, viewer minutes came in a median 33% above what we estimated at booking, and 70% of streamers delivered more than estimated. On YouTube, the median sponsored video got 15% more views than expected. Not every creator gets there: 5% of sponsored Twitch streams fell below half of the expected audience, and 21% of YouTube videos got less than half of the expected views. That’s why we spread budgets over several creators.
Source: Wehype campaign data. Twitch: completed sponsored streams from 2024 to 2026. YouTube: completed sponsored long form videos from 2023 to 2026. Pulled November 4, 2026.
What attribution can and can’t tell you
Creator marketing works partly through people who never click. Someone watches a creator play for two hours on Tuesday, then buys the game on Saturday from their console. No link catches that.
So we separate two kinds of evidence. Direct attribution covers codes, tracked links and clicks, and shows what each creator drove for sure, which is always an undercount. Correlation covers installs, wishlists or sales moving around stream dates. It’s a strong signal, but it’s not proof, and we report it as “after the campaign”, never “because of the campaign”, unless the data supports it.
Honest notes on gaming influencer marketing ROI
Reach is not sales. A view count tells you how many times something was played. It says nothing about whether anyone bought your game.
Don’t sum overlapping reach. Adding up the followers of 50 creators gives you a big number and no information. Audiences overlap, and followers are a snapshot.
Keep paid and organic apart. If short form videos get paid boosts, report boosted views separately from organic ones.
Earned minutes are a good sign, not proof of love. When creators stream longer than they were paid for, they chose to keep playing. That’s worth knowing, but it doesn’t prove they liked the game.
Watch the top creator. When one creator delivers most of a result, we show the numbers with and without them, so you know whether the plan worked or one stream did. It happens more than people think: in our campaigns, the top 10% of creators delivered a median 37% of a Twitch campaign’s viewer minutes and 41% of a YouTube campaign’s views.
Gaming influencer marketing case studies
The best way to judge ROI is to look at real campaigns with the goal next to the result. Our stories cover launches like World of Warcraft: The War Within, which finished 16% over target on total viewer minutes with 164 creators, and micro creator work like GeoGuessr, where 376 creators delivered 8.5M+ viewer minutes on Twitch.
For how campaigns are built in the first place, start at the hub or read about game launches.